3-Tier Hanging Gutter
+ LED Interlighting
System Evaluation
Commercial strawberry production assessment for Armela Farms UAE facility — 100 blocks, 720,000 plants, 25,840 m² total footprint.
Executive Summary
Key findings and headline performance indicators for the full Armela Farms facility
The 3-tier hanging gutter system with integrated LED interlighting is the optimal choice for commercial strawberry production at Armela Farms. The Abu Dhabi agricultural electricity tariff of AED 0.045/kWh — 6.7× lower than the previous report's assumption — transforms the energy cost from the dominant OpEx burden into a manageable line item, creating an exceptionally strong financial case.
Key Performance Indicators — Full Facility
Facility Parameters at a Glance
| Parameter | Specification |
|---|---|
| Total footprint | 25,840 m² (170 m × 152 m) |
| Growing blocks | 100 blocks (20 × 5 grid), each 26 m × 8 m |
| Total plants | 720,000 (7,200 per block, 240,000 per tier) |
| Plant density | 34.6 plants/m² floor area |
| Tiers | 3-tier suspended gutter with LED interlighting |
| Planting model | 2-wave, 56-week cycles, 28-week offset (Wave A / Wave B) |
| Control platform | Hoogendoorn IIVO |
| CO₂ enrichment | 900 ppm target (800–1,000 ppm control band) |
| Substrate | Cocopeat (100% nutrient recirculation) |
| Electricity tariff | AED 0.045/kWh — Abu Dhabi Agricultural |
Facility Description
Technical architecture of the 100-block, 3-tier LED growing system
The Armela Farms facility occupies a total footprint of 170 m × 152 m = 25,840 m², encompassing 100 growing blocks arranged in a 20 × 5 grid, internal walkways, service corridors, utility rooms, and packing/cold storage areas. Each block measures 26 m × 8 m (208 m²) and contains three tiers of suspended gutters with LED light bars mounted beneath each upper tier to illuminate the layer below.
The 3-tier configuration achieves a plant density of 34.6 plants/m² of floor area — compared to the European single-layer greenhouse standard of 6–8 plants/m². This 4.3–5.8× density advantage is the fundamental economic justification for the additional capital cost of the LED interlighting system.
| Parameter | Value |
|---|---|
| Total footprint | 25,840 m² |
| Internal height | 8 m |
| Block grid | 20 × 5 = 100 blocks |
| Block dimensions | 26 m × 8 m = 208 m² |
| Total growing area | 20,800 m² |
| Tiers per block | 3 |
| Tier spacing | 40–50 cm vertical |
| Plant density | 34.6 plants/m² floor area |
Density Advantage
At the same per-plant yield of 2.5 kg/year, the 3-tier system produces 4.3× more output per m² of floor area than a single-layer greenhouse.
Engineering Climate System
V9 Engineering Report — Hoogendoorn IIVO platform specifications
Climate Targets
- Temperature: 23°C (±1°C summer)
- RH: 70% (65–75%)
- CO₂: 900 ppm (800–1,000)
- Tier ΔT: ≤0.7°C
- Tier ΔRH: ≤4–5%
- Dewpoint safety: ≥1.5–2.0°C margin
LED Lighting
- Bottom tier: 300–350 µmol/m²/s
- Middle tier: 200–250 µmol/m²/s
- Top tier: 100–150 µmol/m²/s
- Total LED: 250–268 W/m²
- Efficacy: 2.8–3.0 µmol/J
- Photoperiod: 16.5 h/day
Cooling & HVAC
- Peak cooling: 18.5–28.9 MW total
- LED heat gain: 6.46–6.92 MW
- Transpiration basis: 80 t/day
- FCUs: 400 units (4 per block)
- AHUs: 10 duty + 2 standby
- Canopy airspeed: 0.4 m/s avg
| Scenario | Cooling Requirement | Notes |
|---|---|---|
| Peak summer (excl. LED heat) | 12.0–22.0 MW (464–851 W/m²) | Outside design: 52°C |
| LED sensible heat (coincident) | 6.46–6.92 MW (250–268 W/m²) | ~100% of LED power becomes heat |
| Total coincident cooling | 18.5–28.9 MW (714–1,119 W/m²) | Design basis for HVAC sizing |
| Peak winter heating (lights-off) | 3.2–4.8 MW (124–186 W/m²) | Outside design: 5°C |
| Net heating during full lighting | ~0 MW | LED heat offsets envelope losses |
Production Model
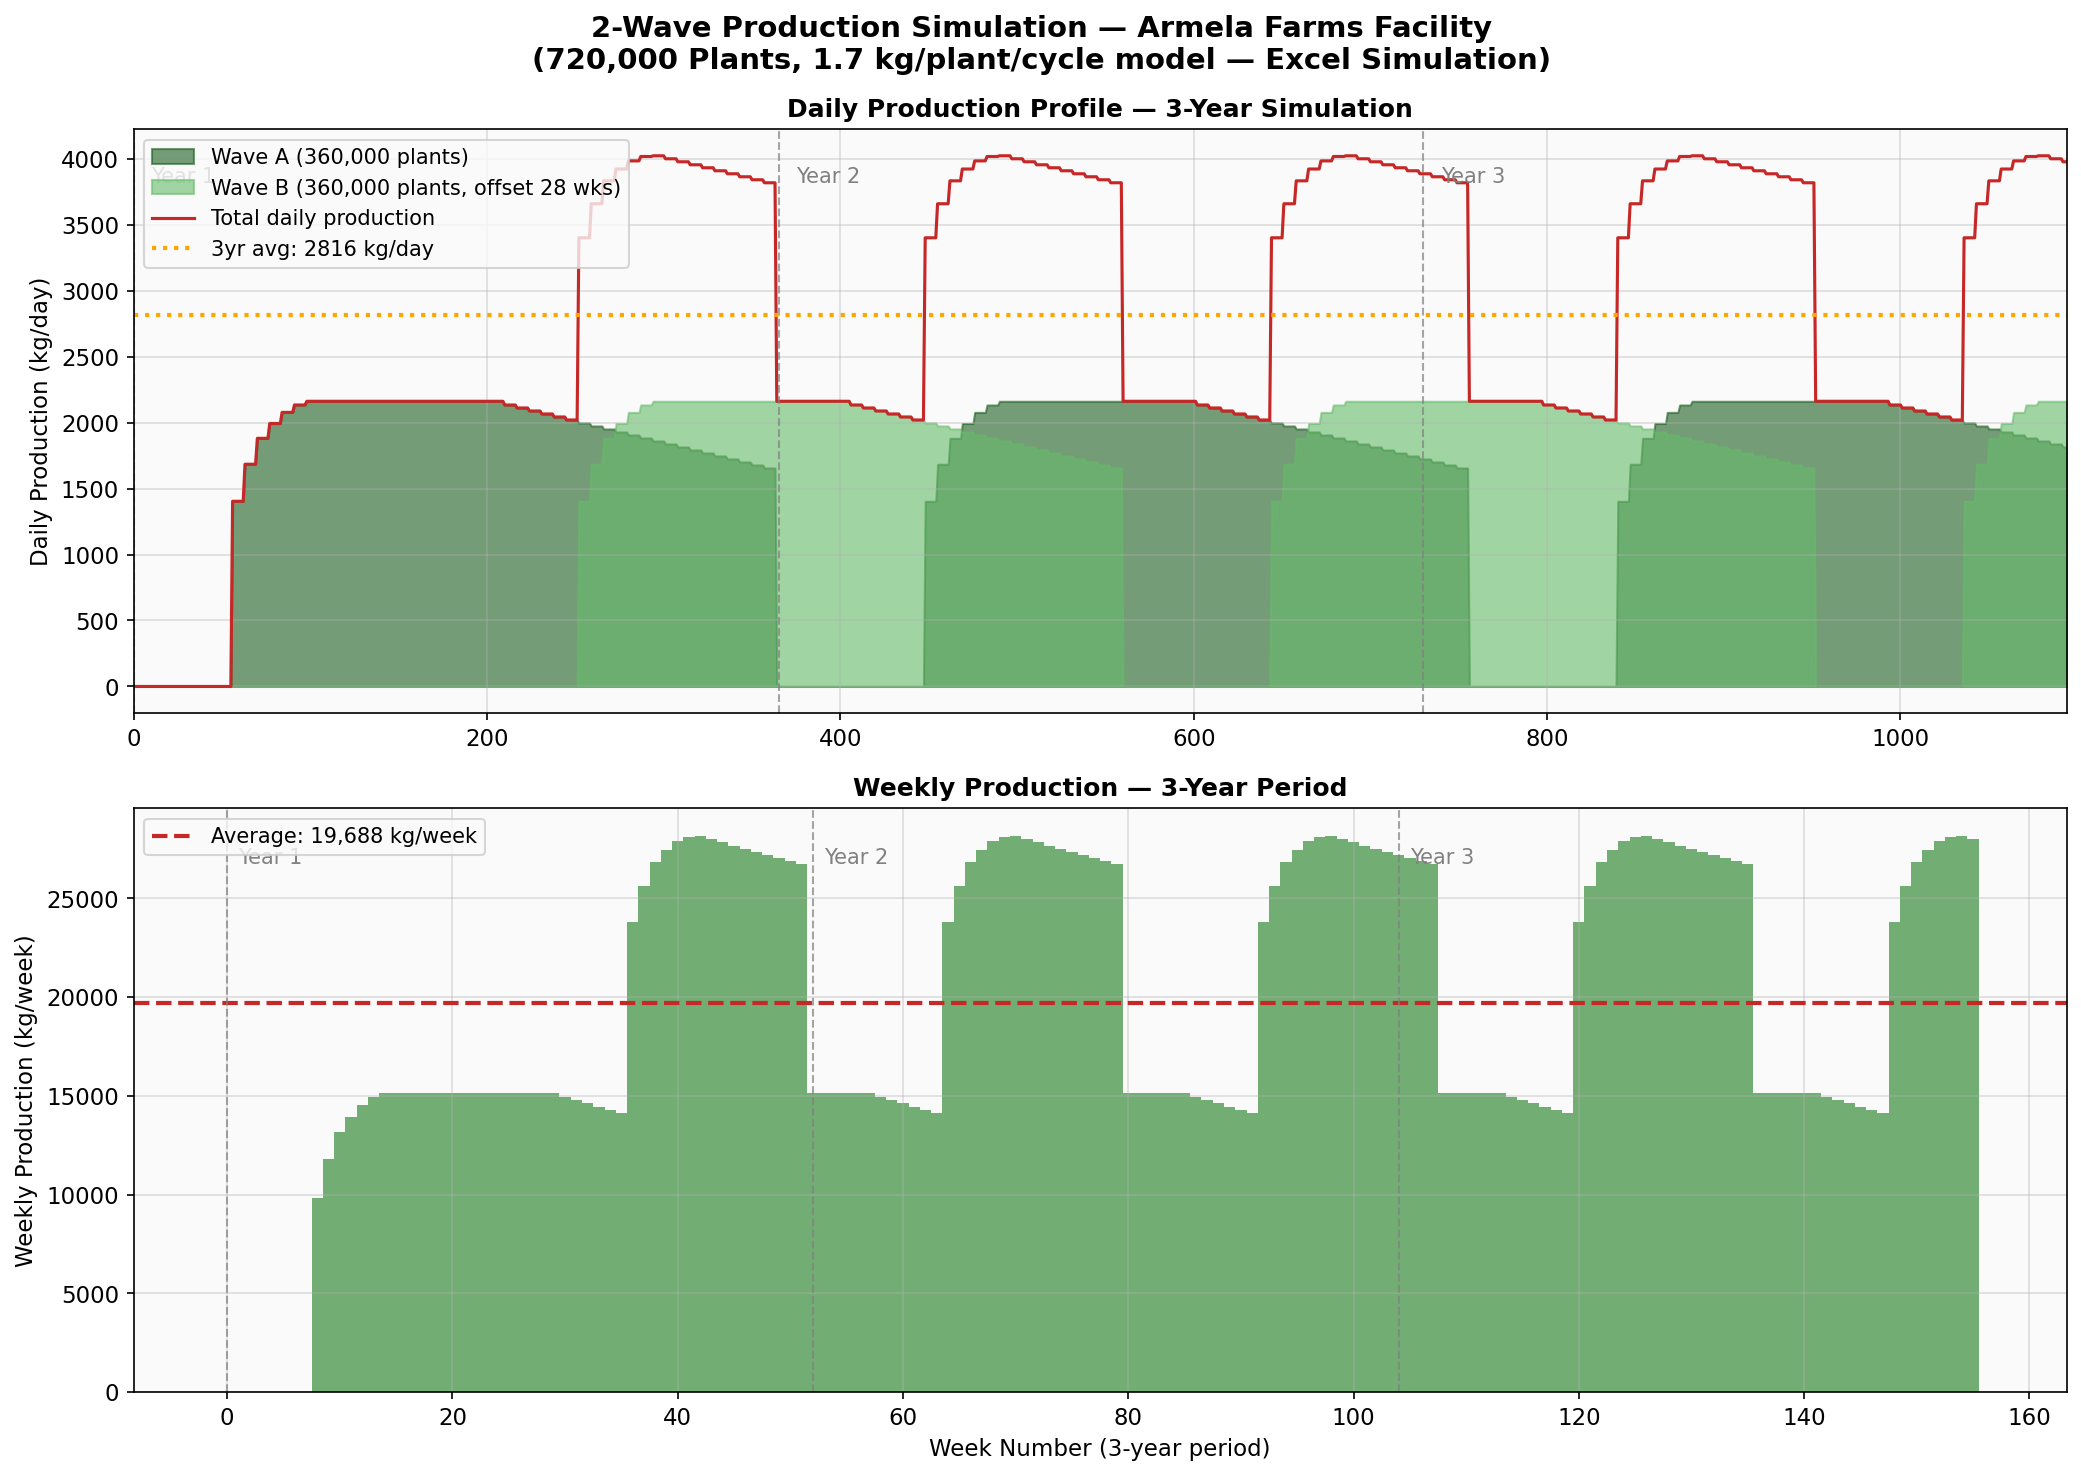
2-wave planting system — 56-week cycles, 28-week offset between Wave A and Wave B
The Armela Farms production model uses a 2-wave planting system designed to provide continuous, year-round production with smoothed daily output. Wave A (360,000 plants) starts at Day 0; Wave B (360,000 plants) starts at Day 196 (Week 28). When Wave A enters its turnaround period, Wave B is at peak production — and vice versa.
| Parameter | Value |
|---|---|
| Wave count | 2 (Wave A + Wave B) |
| Plants per wave | 360,000 (50% each) |
| Cycle length | 56 weeks (392 days) |
| Wave A start | Day 0 (Week 0) |
| Wave B start | Day 196 (Week 28) |
| Establishment | Weeks 1–8 (no harvest) |
| Harvest period | Weeks 9–52 (44 weeks) |
| Turnaround | Weeks 53–56 (4 weeks) |
3-Year Simulation Results (1.7 kg/plant/cycle)
total
avg daily
peak daily
total
avg daily
peak daily
total
avg daily
peak daily
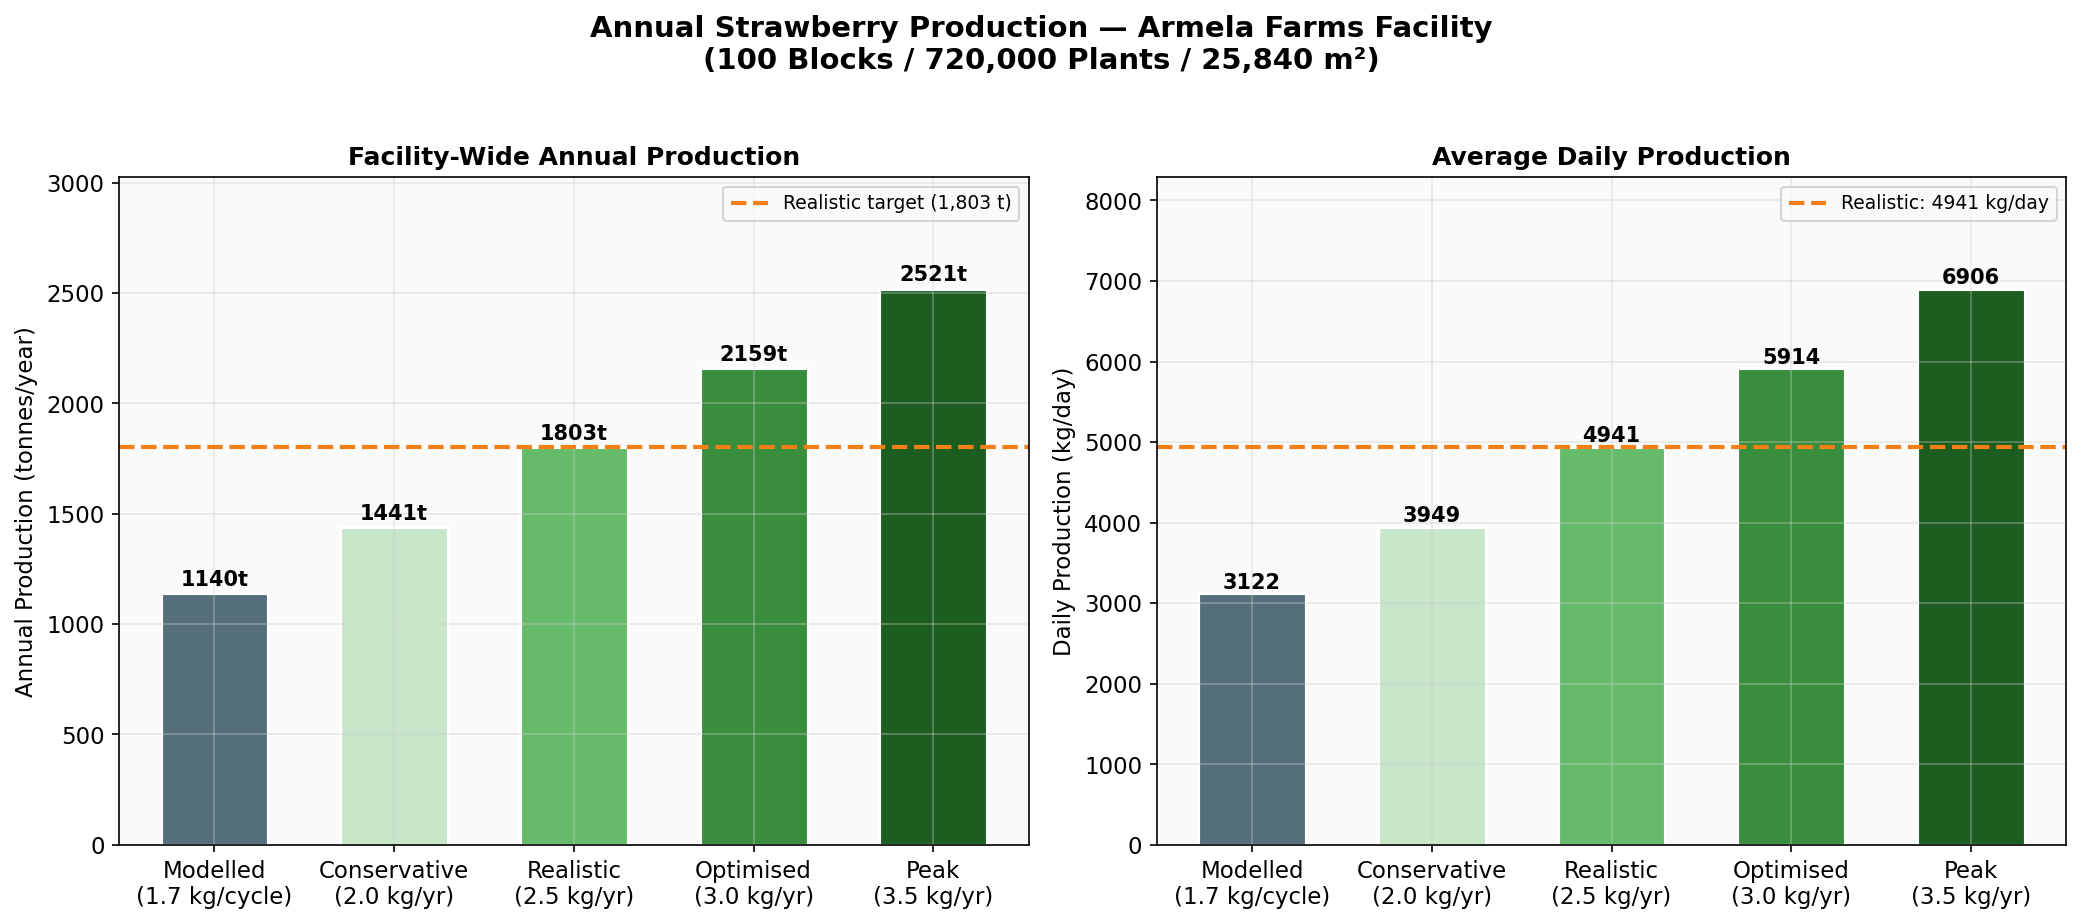
Yield Analysis
Corrected and reconciled per-plant yield figures — 2.0 to 3.5 kg/plant/year
Note on Version History: The Version 1.0 report contained a yield calculation error — it used European single-layer greenhouse density (~8 plants/m²) to calculate per-m² yield, producing a nonsensical per-plant yield of 0.58–1.17 kg/year. This has been fully corrected. The correct per-plant yield for a fully optimised, CO₂-enriched, climate-controlled facility is 2.0–3.5 kg/plant/year, consistent with published benchmarks from Proefcentrum Hoogstraten (2.43 kg/plant in 6 months, 2023) and Wageningen UR.
| Scenario | kg/plant/year | kg/plant/cycle (56 wks) | Annual Facility (kg) | Daily Avg (kg/day) |
|---|---|---|---|---|
| Modelled (Excel) | 1.58 | 1.70 | 1,139,694 | 3,122 |
| Conservative | 2.0 | 2.15 | 1,441,378 | 3,949 |
| Realistic (base case) | 2.5 | 2.69 | 1,803,398 | 4,941 |
| Optimised | 3.0 | 3.22 | 2,158,714 | 5,914 |
| Peak | 3.5 | 3.76 | 2,520,735 | 6,906 |
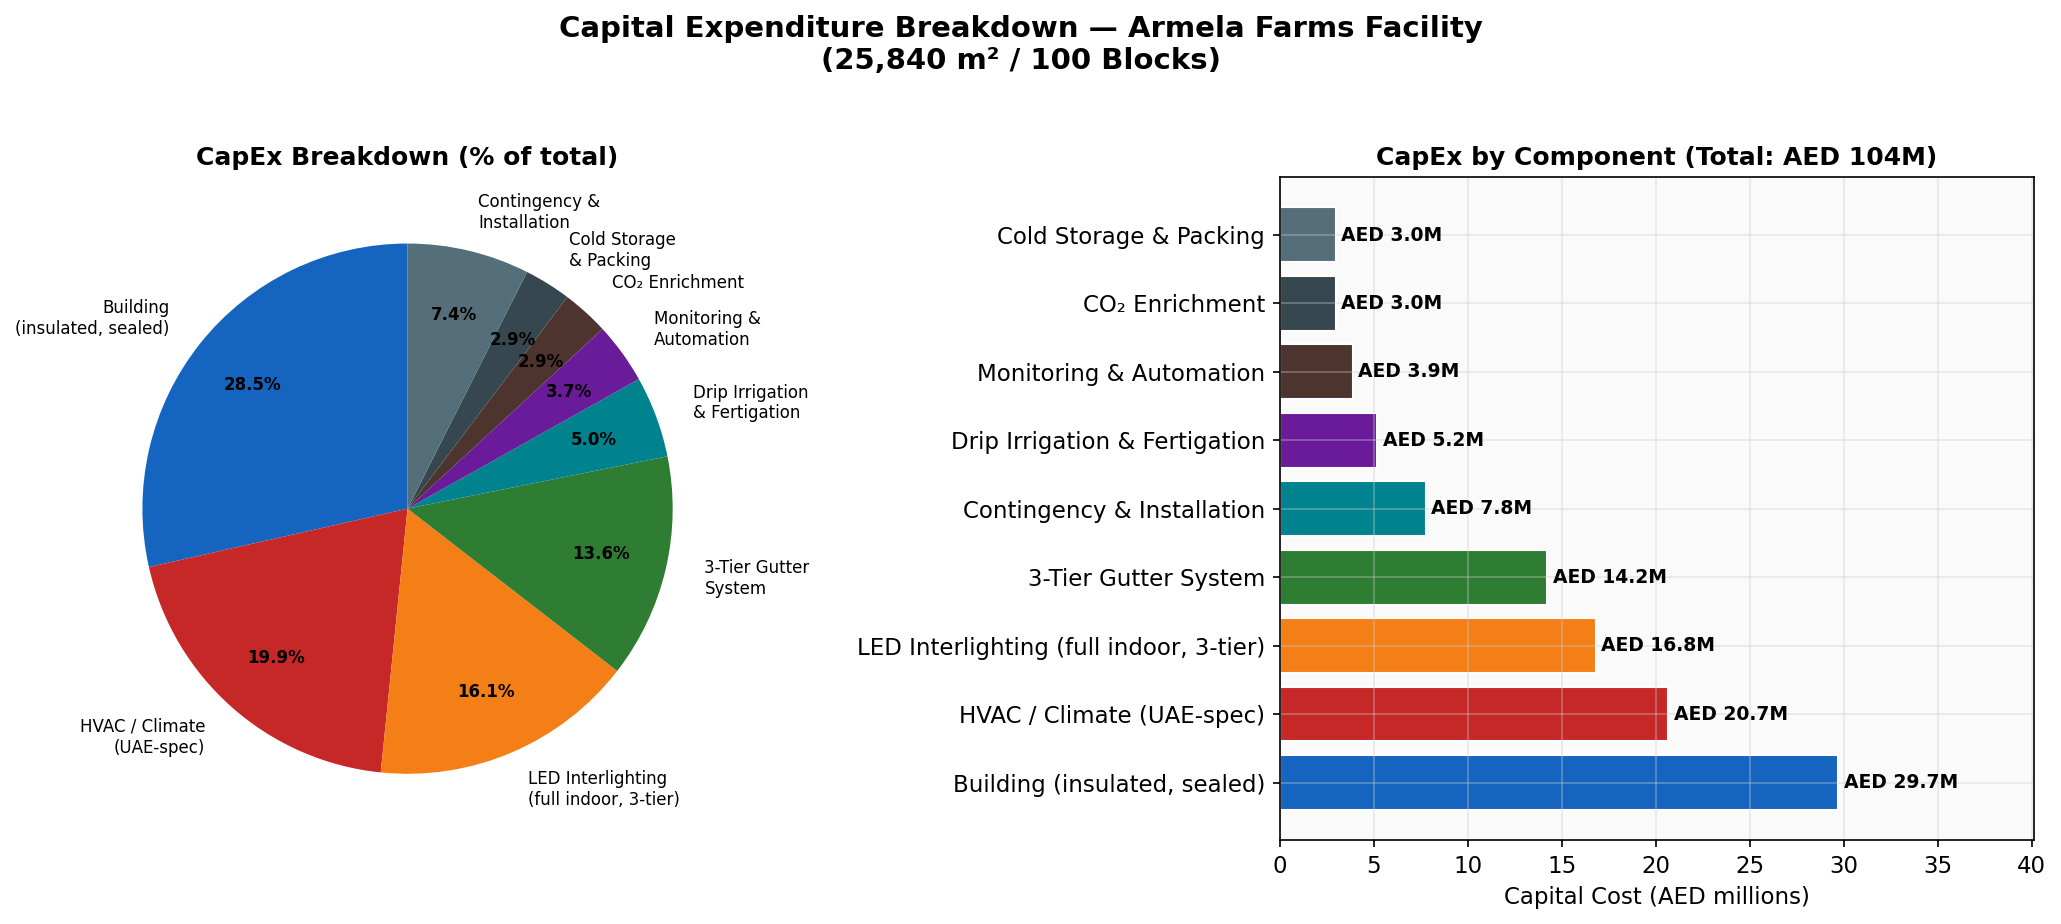
Capital Expenditure
Full facility CapEx breakdown — AED 104 million total (mid estimate)
| Component | AED/m² (Low) | AED/m² (Mid) | AED/m² (High) | Facility Total (Mid) |
|---|---|---|---|---|
| Building (insulated, sealed) | 800 | 1,150 | 1,500 | AED 29,716,000 |
| HVAC / Climate (UAE-spec) | 600 | 800 | 1,000 | AED 20,672,000 |
| LED Interlighting (3-tier) | 500 | 650 | 800 | AED 16,796,000 |
| 3-Tier Gutter System | 400 | 550 | 700 | AED 14,212,000 |
| Drip Irrigation & Fertigation | 150 | 200 | 250 | AED 5,168,000 |
| Monitoring & Automation | 100 | 150 | 200 | AED 3,876,000 |
| CO₂ Enrichment | 80 | 115 | 150 | AED 2,972,000 |
| Cold Storage & Packing | 80 | 115 | 150 | AED 2,972,000 |
| Contingency & Installation | 200 | 300 | 400 | AED 7,752,000 |
| TOTAL | 2,910 | 4,030 | 5,150 | AED 104,135,200 |
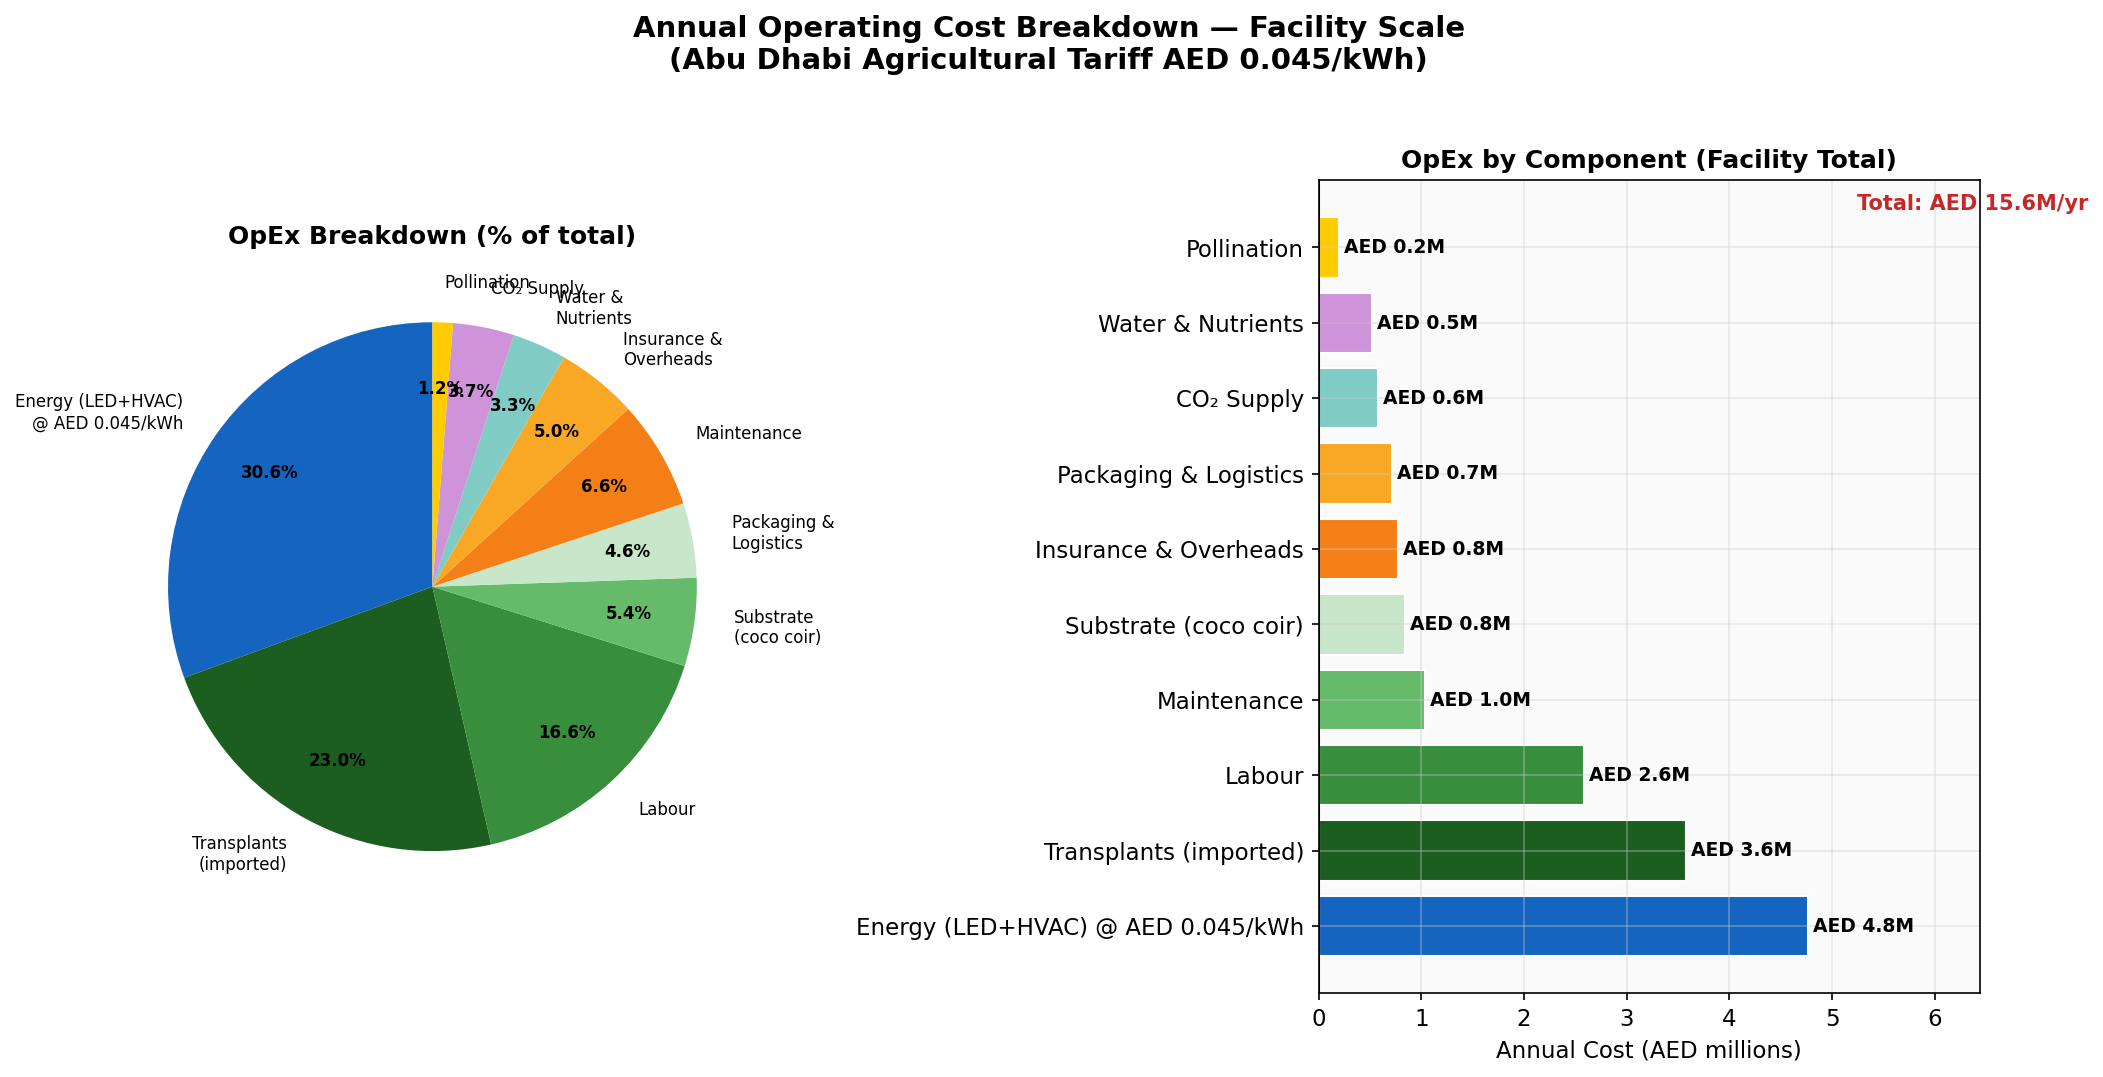
Operating Expenditure
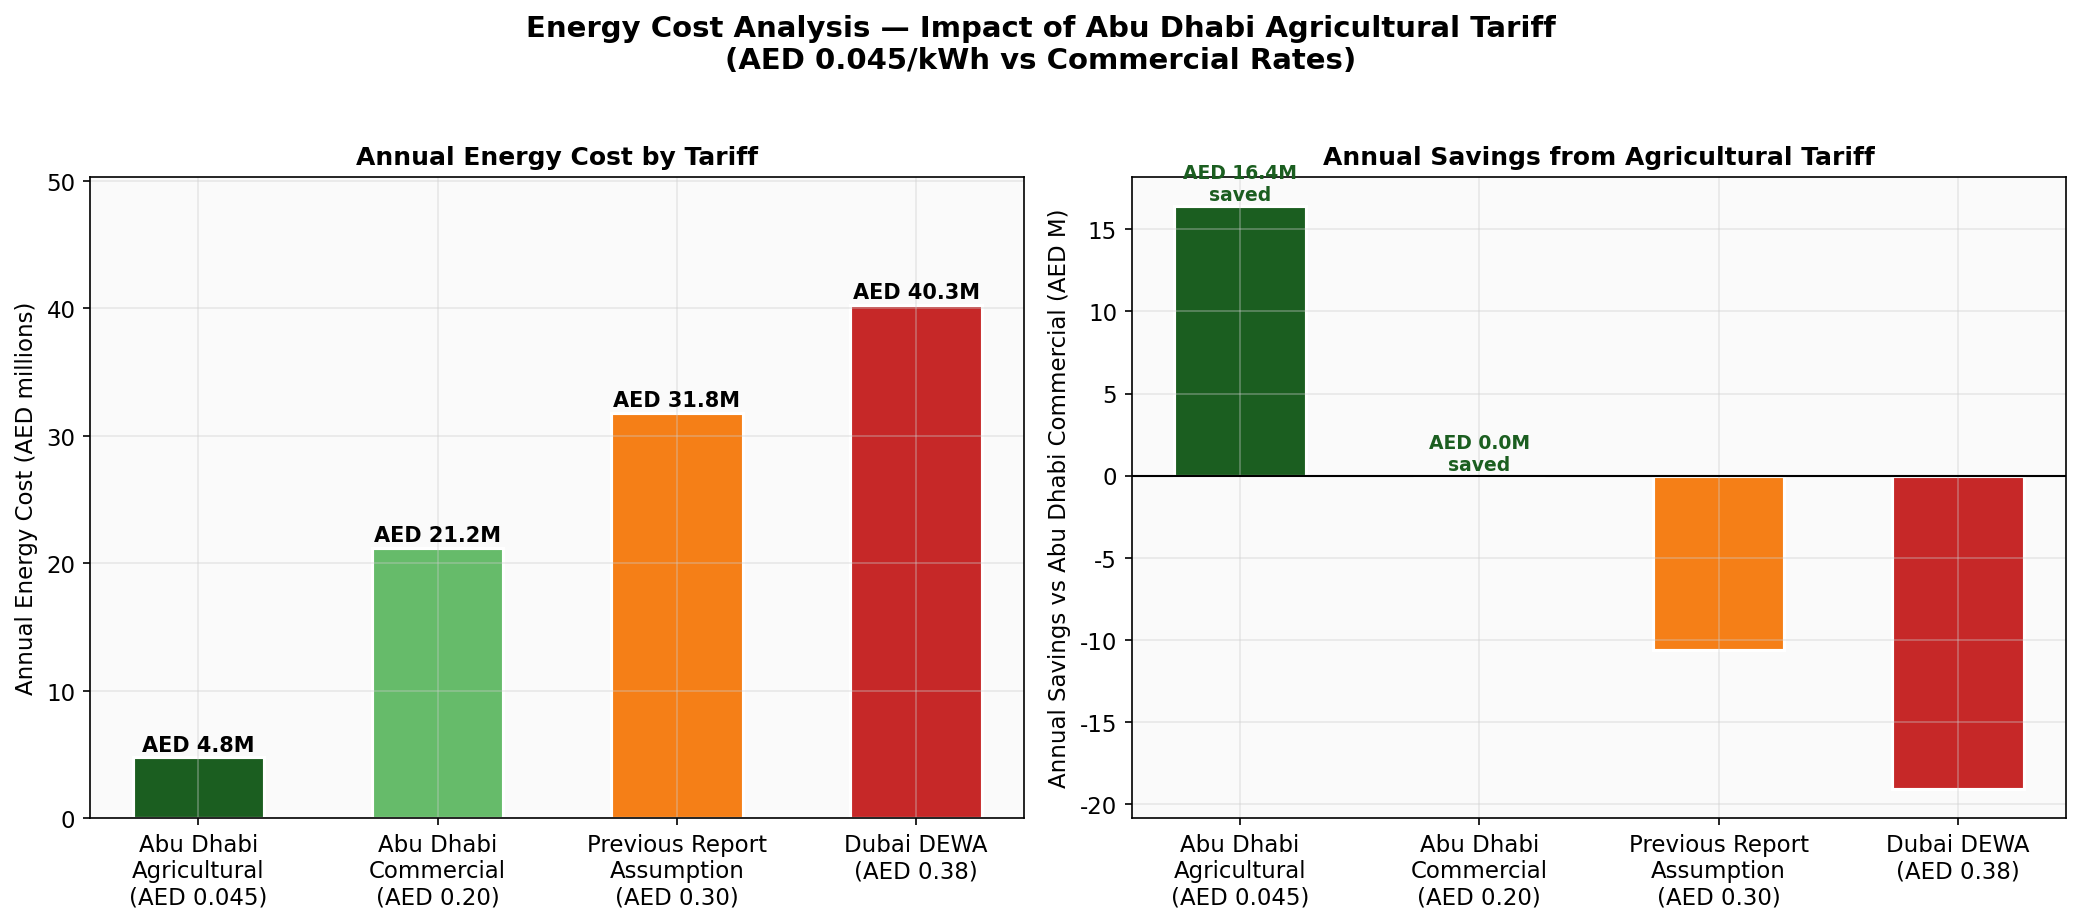
Annual OpEx at AED 0.045/kWh agricultural tariff — AED 15.6 million/year
AED 0.045/kWh Agricultural Tariff
The Abu Dhabi agricultural electricity tariff is 6.7× lower than the AED 0.30/kWh used in the previous report. This single correction saves AED 27,017,000 per year and transforms the project from marginal to exceptionally profitable.
| Cost Category | AED/m²/yr (Mid) | Facility/yr (Mid) |
|---|---|---|
| Energy (AED 0.045/kWh agri tariff) | 184.5 | AED 4,768,000 |
| Transplants (imported, 34.6/m²) | 138.5 | AED 3,579,000 |
| Labour (skilled grower + harvest) | 100.0 | AED 2,584,000 |
| Maintenance & Repairs | 40.0 | AED 1,034,000 |
| Substrate replacement (coco coir) | 32.5 | AED 840,000 |
| Insurance & Overheads | 30.0 | AED 775,000 |
| CO₂ Supply | 22.5 | AED 581,000 |
| Water & Nutrients (RO) | 20.0 | AED 517,000 |
| Packaging & Logistics | 27.5 | AED 711,000 |
| Bumblebee Pollination | 7.5 | AED 194,000 |
| TOTAL | 603.0 | AED 15,582,000 |
Revenue & Profitability
Break-even analysis, revenue projections, and 10-year cash flow
Profitability Summary — Realistic Scenario (AED 28/kg)
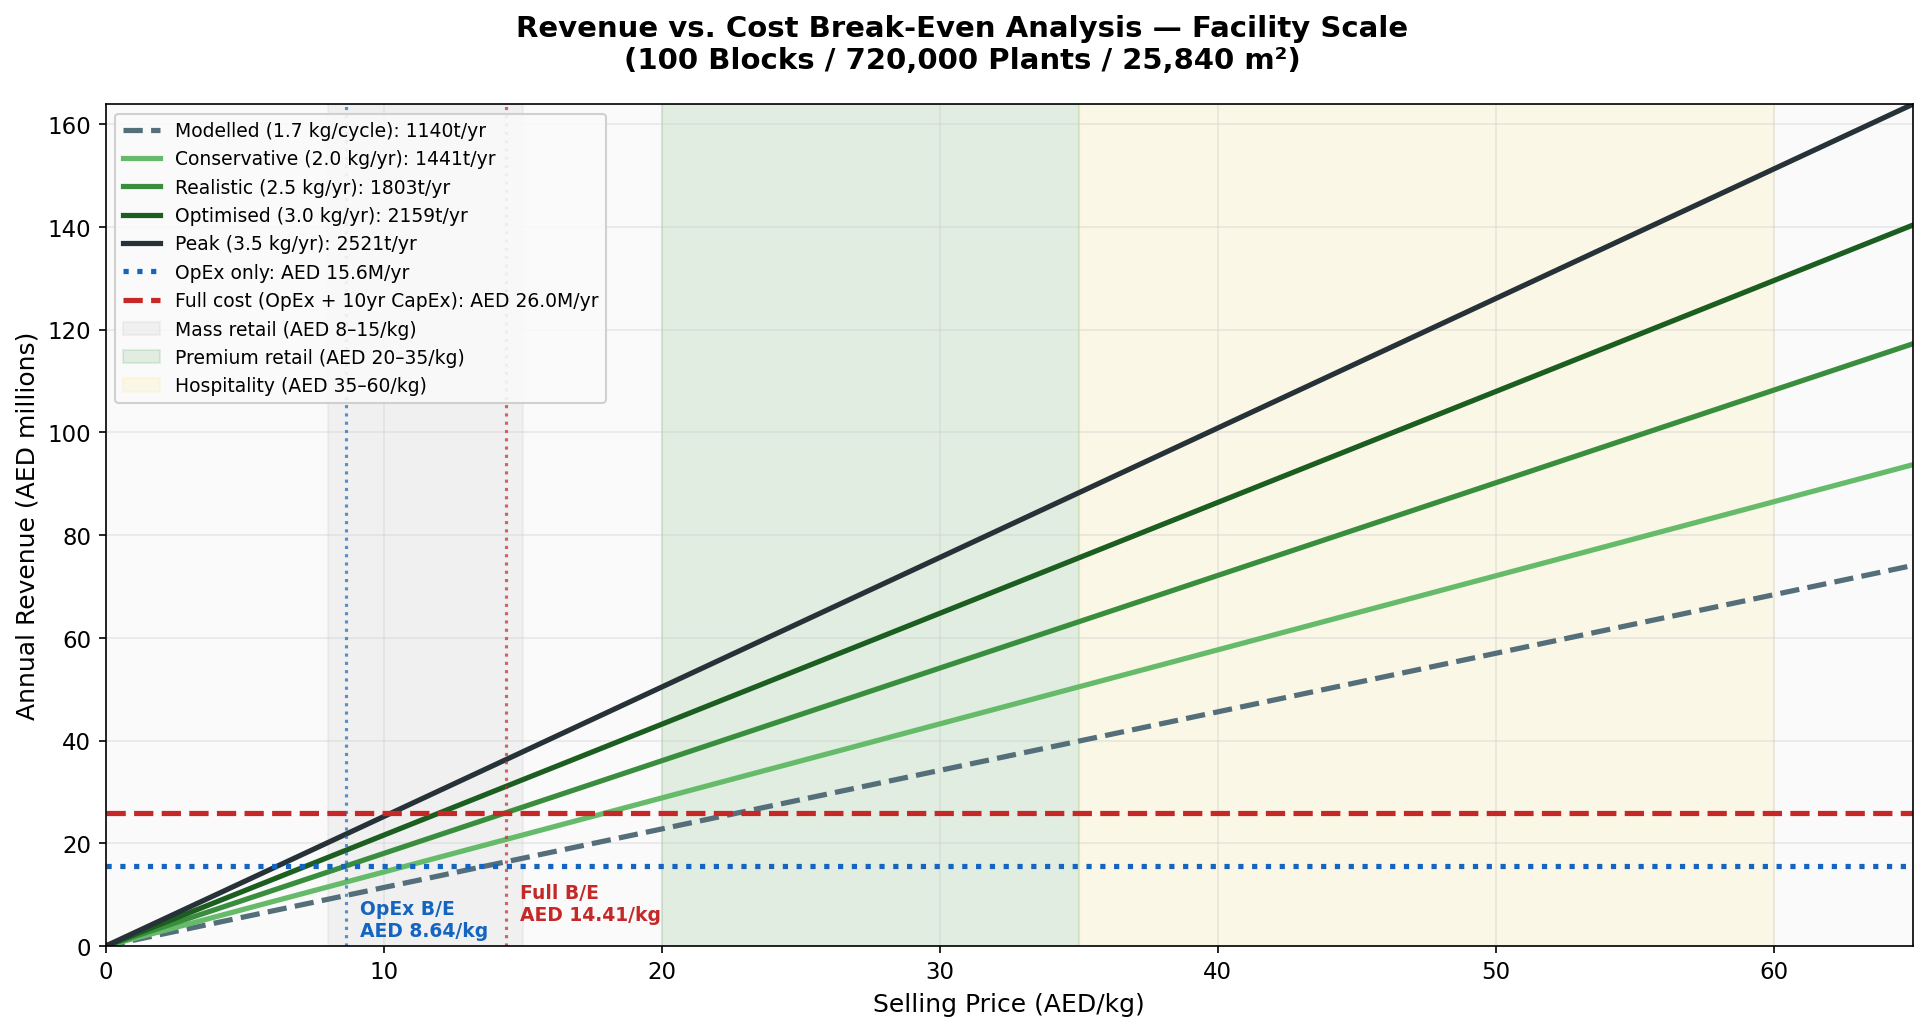
Break-Even Price Analysis
| Cost Basis | Realistic Yield (1,803,398 kg) | Conservative Yield (1,441,378 kg) |
|---|---|---|
| OpEx only: AED 15,582,000/yr | AED 8.64/kg | AED 10.81/kg |
| Full cost (OpEx + 10yr CapEx): AED 25,995,000/yr | AED 14.41/kg | AED 18.03/kg |
| UAE premium retail price | AED 20–35/kg | — |
| UAE hospitality price | AED 35–60/kg | — |
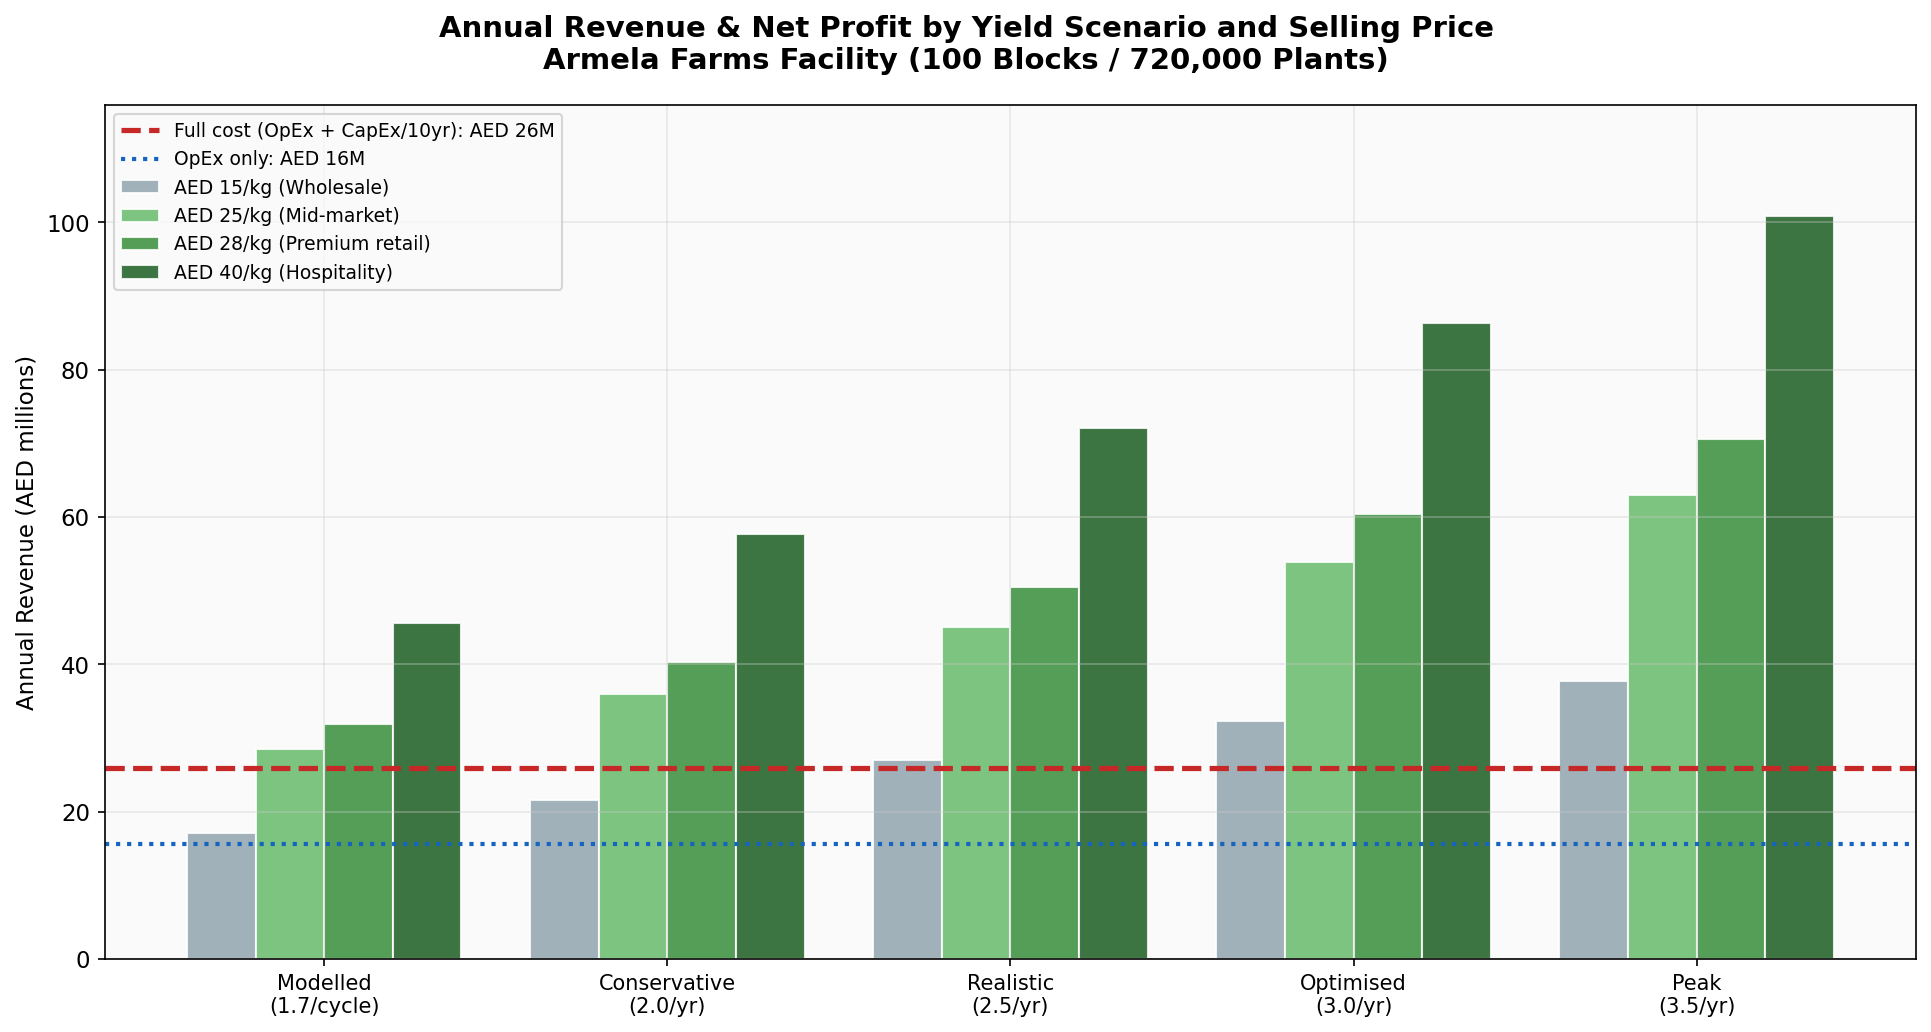
Revenue Projections by Yield and Price
| Yield Scenario | kg/yr | @ AED 25/kg | @ AED 28/kg | @ AED 40/kg |
|---|---|---|---|---|
| Modelled (1.7/cycle) | 1,139,694 | AED 28,492,000 | AED 31,911,000 | AED 45,588,000 |
| Conservative (2.0/yr) | 1,441,378 | AED 36,034,000 | AED 40,359,000 | AED 57,655,000 |
| Realistic (2.5/yr) | 1,803,398 | AED 45,085,000 | AED 50,495,000 | AED 72,136,000 |
| Optimised (3.0/yr) | 2,158,714 | AED 53,968,000 | AED 60,444,000 | AED 86,349,000 |
| Peak (3.5/yr) | 2,520,735 | AED 63,018,000 | AED 70,581,000 | AED 100,829,000 |
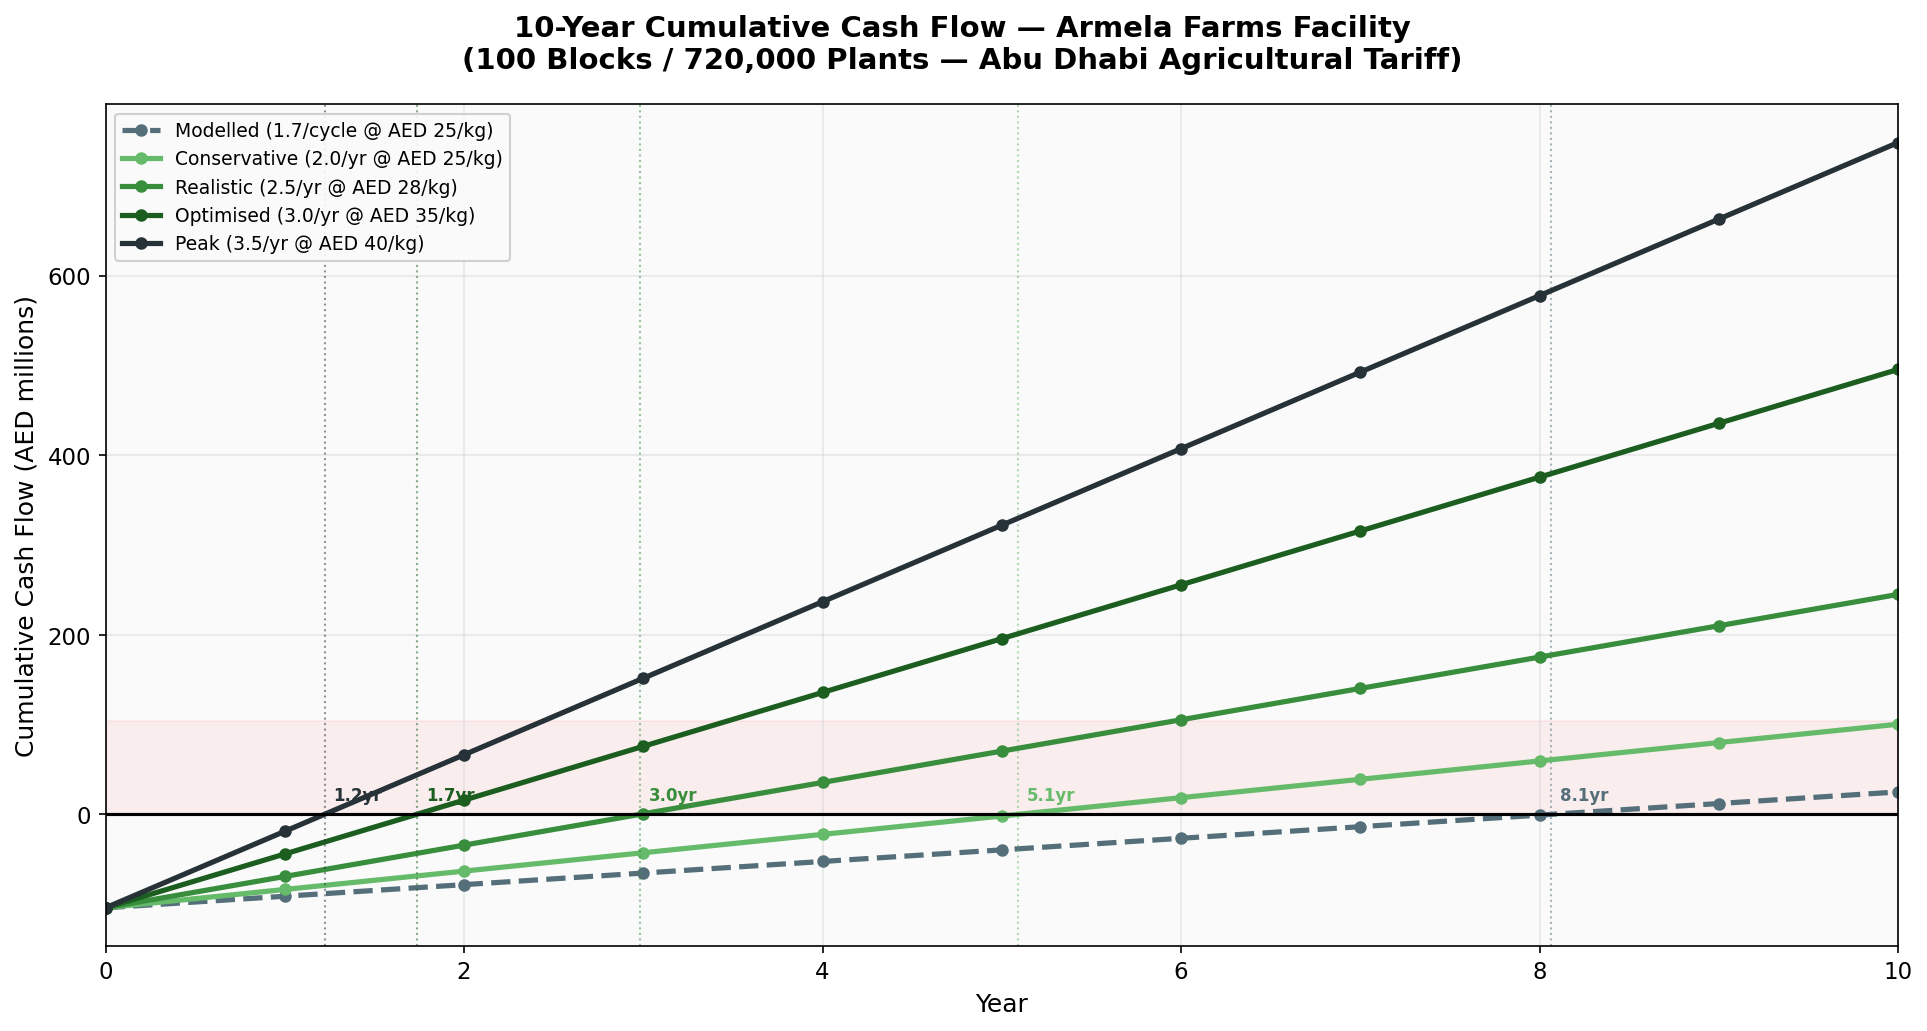
10-Year Payback Analysis
| Scenario | Yield (kg/yr) | Price | Payback Period | 10yr Cumulative Cash Flow |
|---|---|---|---|---|
| Modelled (1.7/cycle) | 1,139,694 | AED 25/kg | 6.4 years | AED 59M |
| Conservative (2.0/yr) | 1,441,378 | AED 25/kg | 4.2 years | AED 143M |
| Realistic (2.5/yr) | 1,803,398 | AED 28/kg | 3.0 years | AED 141M |
| Optimised (3.0/yr) | 2,158,714 | AED 35/kg | 2.3 years | AED 241M |
| Peak (3.5/yr) | 2,520,735 | AED 40/kg | 1.9 years | AED 311M |
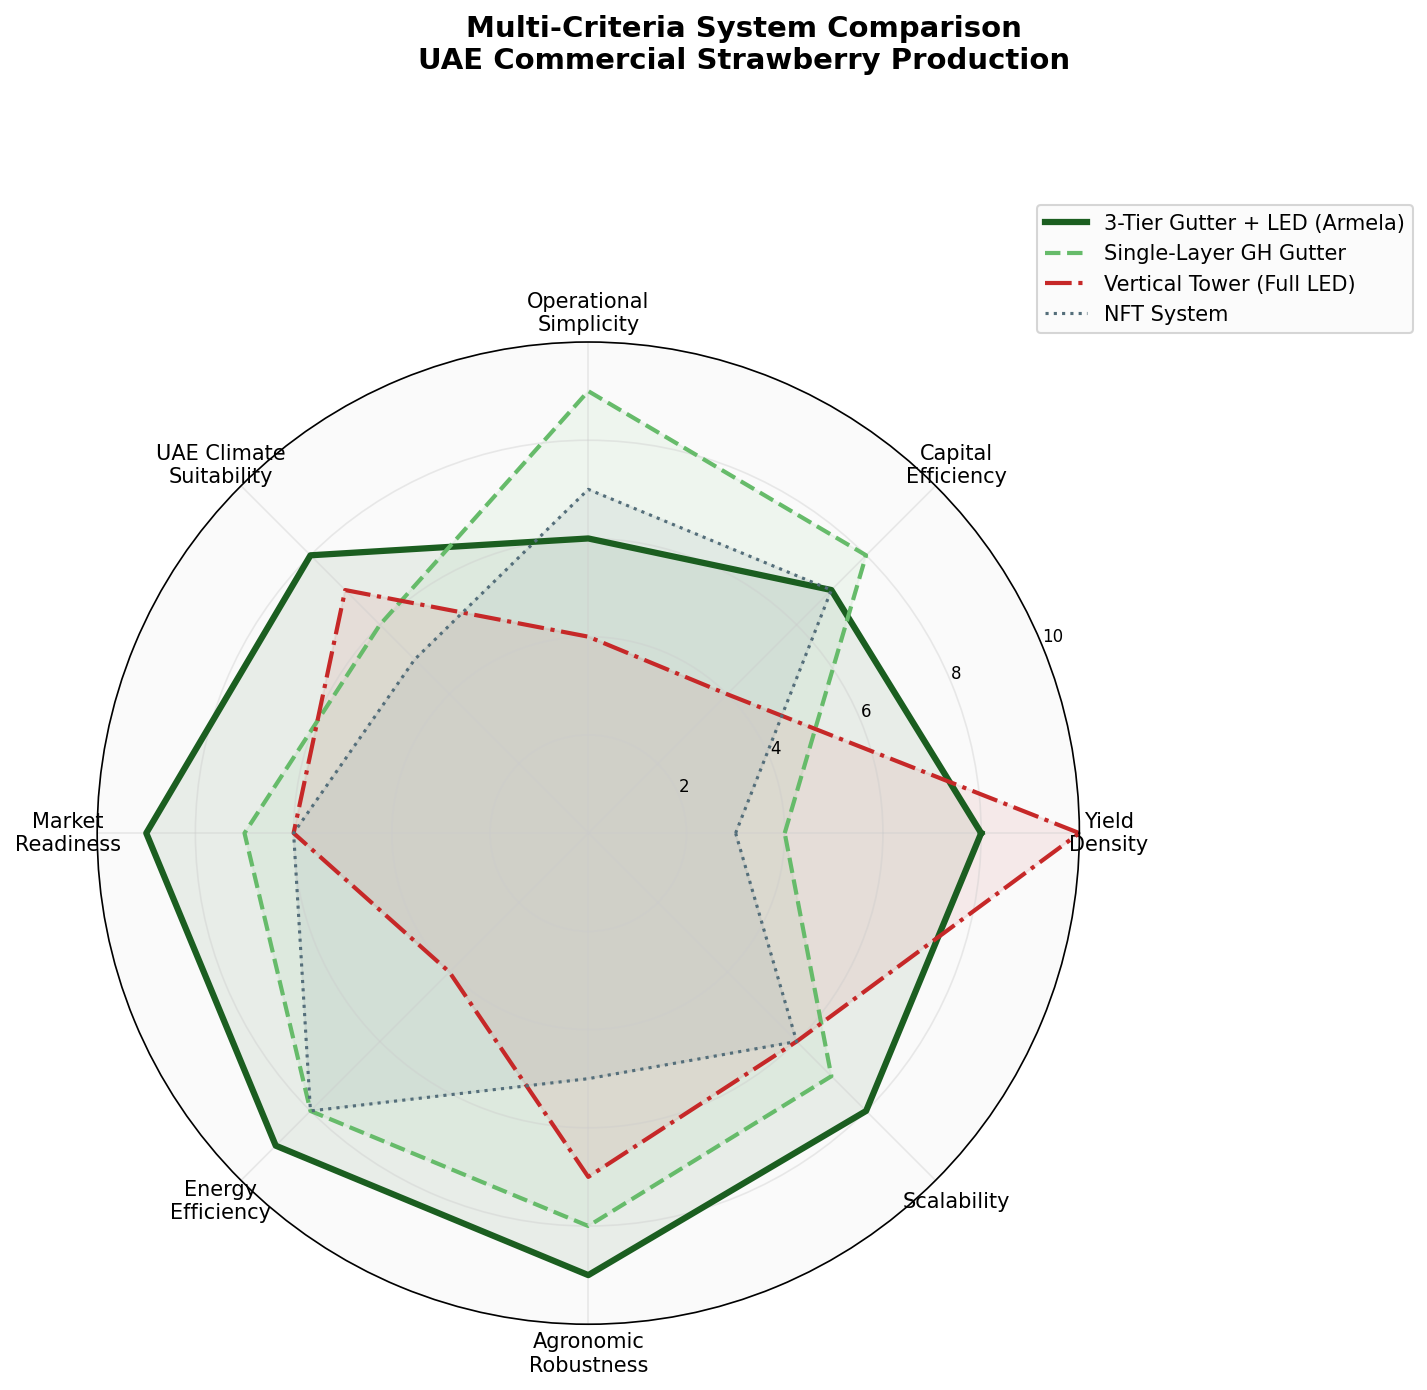
System Comparison
Multi-criteria evaluation against competing growing systems for UAE commercial strawberry production
| Criterion | 3-Tier Gutter + LED | Single-Layer GH | Vertical Tower | NFT |
|---|---|---|---|---|
| Yield density (kg/m²) | 8/10 | 4/10 | 10/10 | 3/10 |
| Capital efficiency | 7/10 | 8/10 | 4/10 | 7/10 |
| Operational simplicity | 6/10 | 9/10 | 4/10 | 7/10 |
| UAE climate suitability | 8/10 | 6/10 | 7/10 | 5/10 |
| Market readiness (UAE) | 9/10 | 7/10 | 6/10 | 6/10 |
| Energy efficiency | 9/10 | 9/10 | 4/10 | 8/10 |
| Agronomic robustness | 9/10 | 8/10 | 7/10 | 5/10 |
| Scalability | 8/10 | 7/10 | 6/10 | 6/10 |
| Weighted Average | 8.0/10 | 7.3/10 | 6.0/10 | 5.9/10 |
Risk Assessment
Key risks, probability, impact, and mitigation strategies
| Risk | Probability | Impact | Severity | Mitigation |
|---|---|---|---|---|
| Agricultural tariff reclassification | Low | Very High | High | Confirm tariff in writing with ADDC before capital commitment |
| Transplant supply disruption | Medium | High | High | Multi-supplier strategy; 3-month buffer stock; staggered Wave A/B orders |
| Botrytis / disease outbreak | Medium | High | High | Strict IPM; humidity control per V9 report; resistant varieties |
| Yield below conservative target | Low | High | Medium | Experienced head grower; phased scale-up; crop recipe optimisation |
| Market price compression | Low | Medium | Medium | Hospitality channel focus; brand differentiation; Driscoll's licensing |
| HVAC system failure (UAE summer) | Low | Very High | High | Redundant cooling units (N+1); 24/7 monitoring; backup generator |
| Skilled labour shortage | High | Medium | High | Expatriate recruitment; 2-year training programme |
| CO₂ supply disruption | Medium | Medium | Medium | Dual supplier; 2-week on-site storage buffer |
Strongly
Recommended
The 3-tier hanging gutter system with integrated LED interlighting, drip irrigation, and CO₂ enrichment is the correct and optimal system for commercial strawberry production at Armela Farms' UAE facility. The combination of the Abu Dhabi agricultural electricity tariff (AED 0.045/kWh), the 3-tier system's 4.3× land productivity advantage, and UAE premium market pricing creates an exceptionally strong financial case.